Understanding a Histogram
Most of the people who use a digital camera or a DSLR camera would have come across the histogram and many still don’t know what information to grab from it. Understanding histogram is a pretty easy thing. In simple words, it tells you whether the captured image is properly exposed or not. This will help you to improve as a photographer.
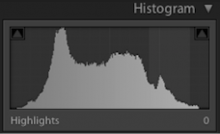
There are many types of Histograms. When it comes to photography we deal with RGB histogram. It is nothing but a representation of depth of RGB colors in the picture shown over a graph. An example of a histogram is shown below.
The x-axis will give you the pixel number or the intensity and the y axis will give you the tonal range. The tonal range can be again broken down into three sections
- Shadows
- Midtones
- Highlights
If you divide the graph into 3 equal vertical planes then the right most part of the graph indicates the shadows. This will give you an indication of how much percentage of your image is dark. The center portion indicates the midtones. This is a place of average brightness. The last portion, highlights indicate the amount of brightly lit areas in the photograph.
Now the question will be, what would be the ideal shape of the histogram? In general you can assume it to be a mountain with its peak coming at the center portion, with evenly distributed side halves. Actually, there is nothing like an ideal histogram. Histogram depends on the type of photography you are into. Suppose you are taking some High key portraits then your histogram would be shifted to the right side of the graph since the image will be captured with lots of lightings. If you are shooting a low key portrait then the histogram would be in the opposite way, the graph would be shifted to the left hand side indicating more shadows and darkness in the picture. So, understanding a histogram is important to make sure that you capture what you intend to.


